
landlordgrants.net
Editorial UK landlord grants & compliance site. Written by a working landlord. Sources on every page.
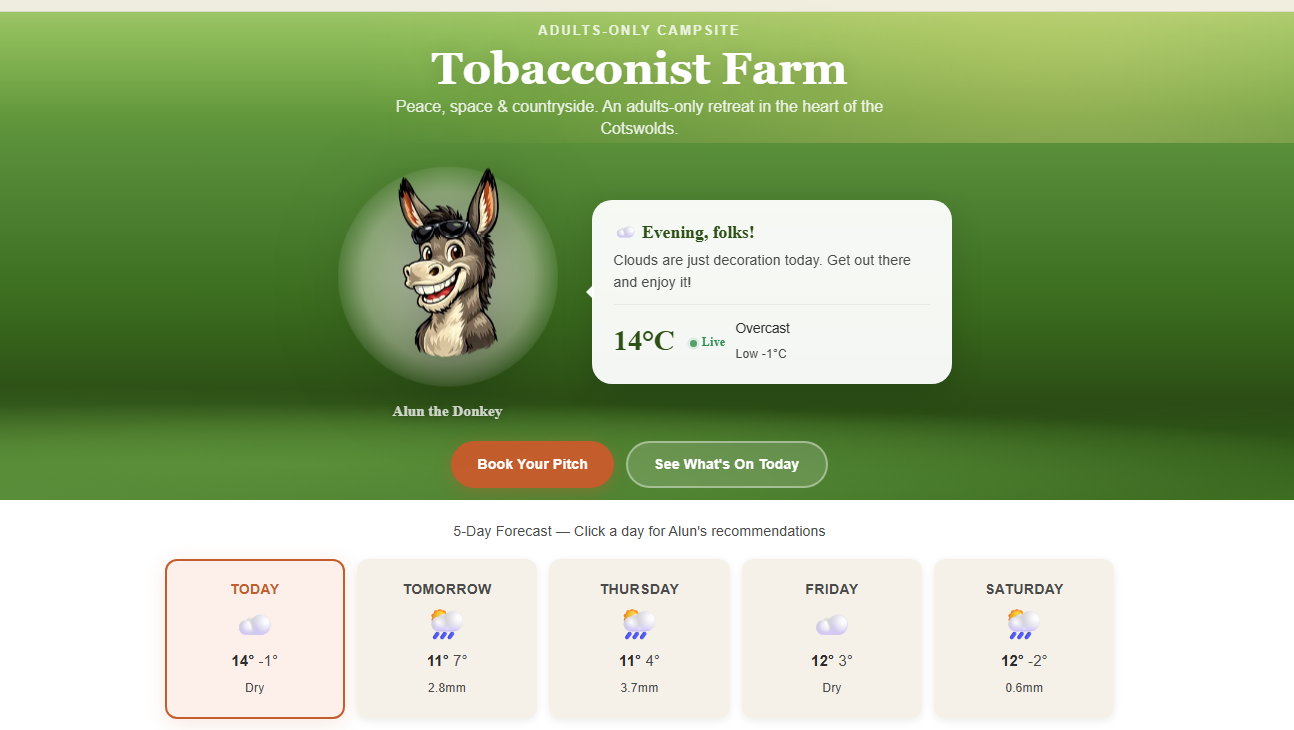
Tobacconist Farm
Adults-only Cotswolds campsite. Warm rustic aesthetic. Direct booking, no agency fees.
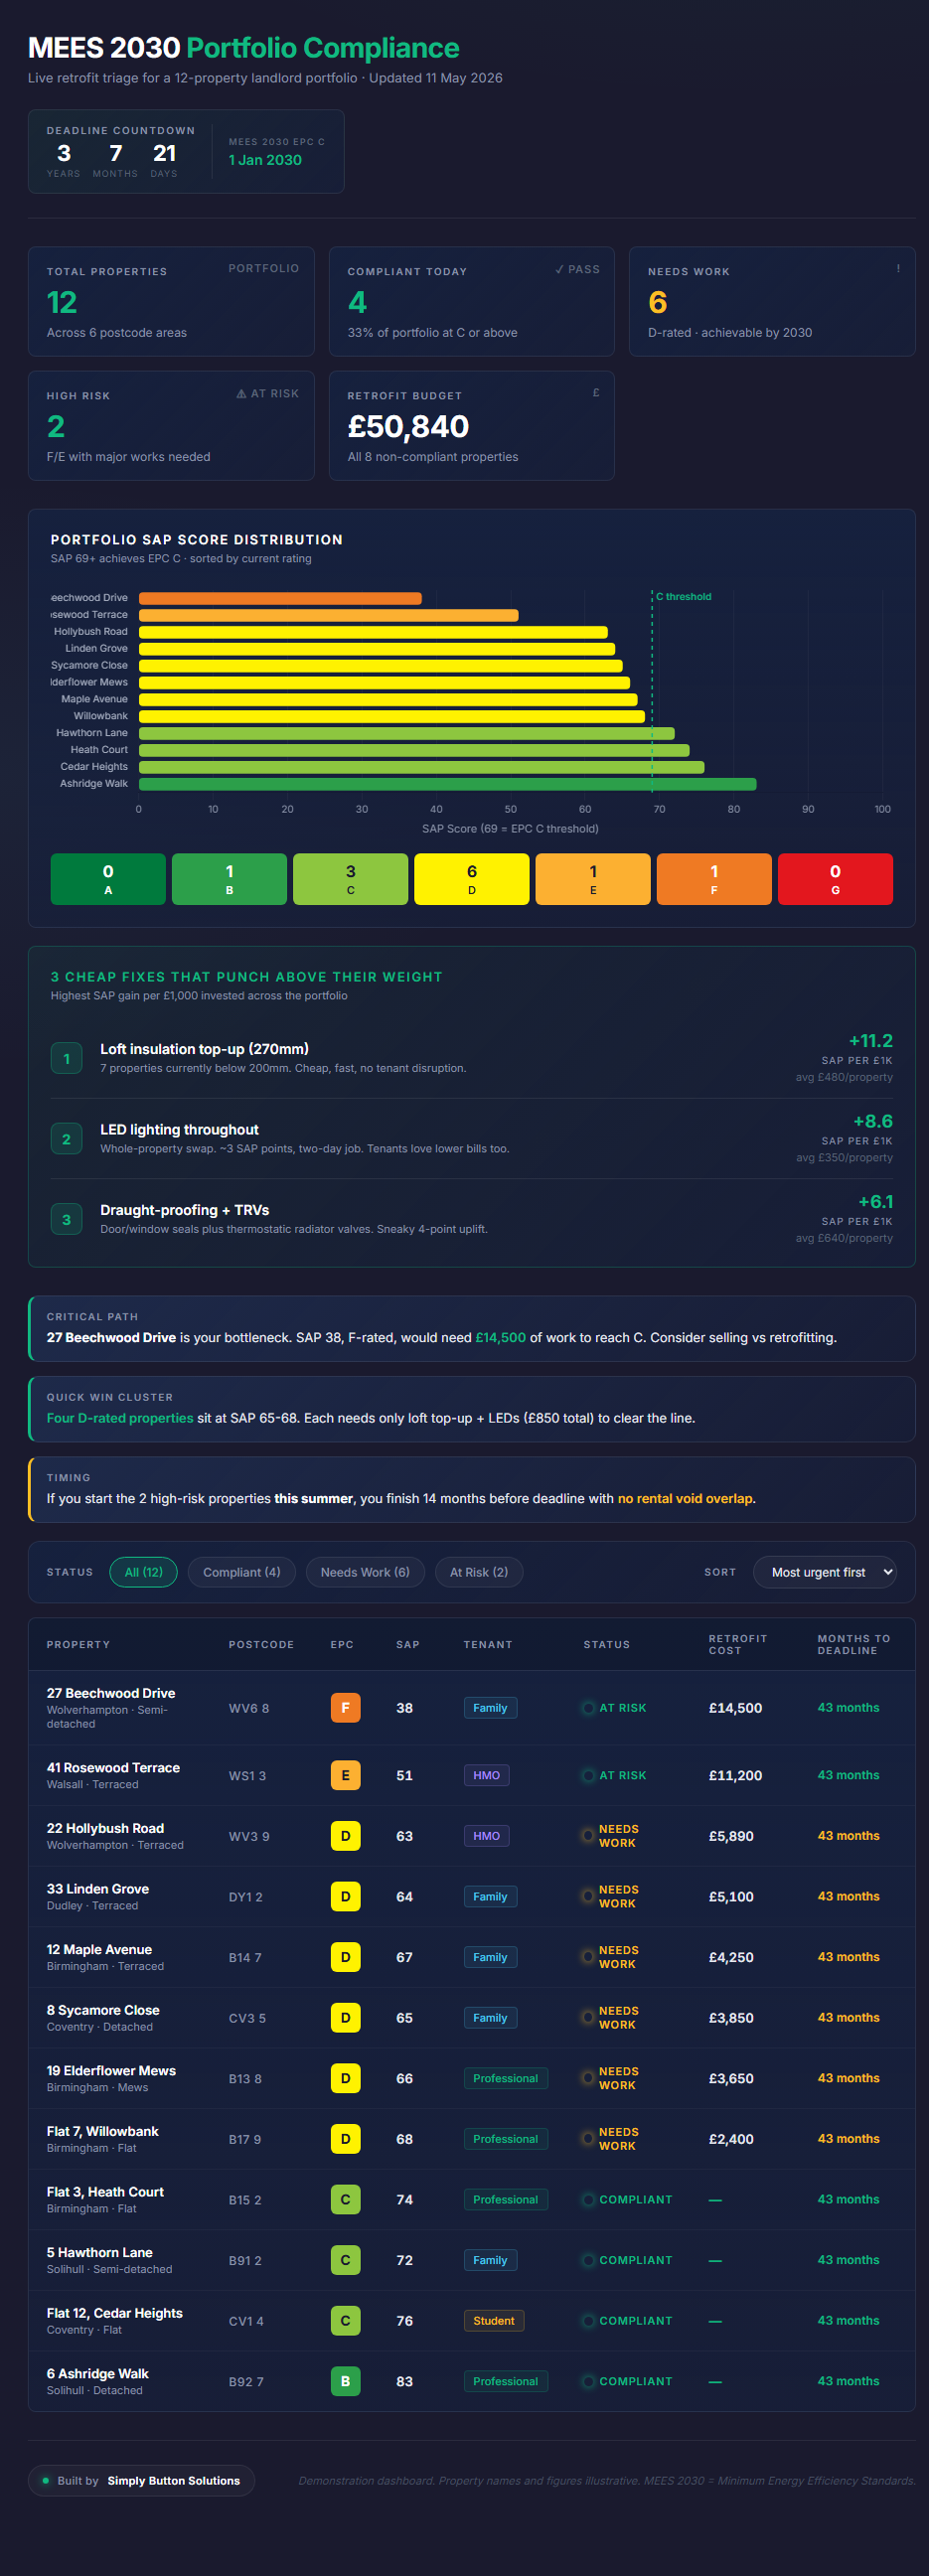
EPC Compliance Dashboard
12-property portfolio. Live MEES 2030 countdown. £50,840 retrofit budget broken down by property.
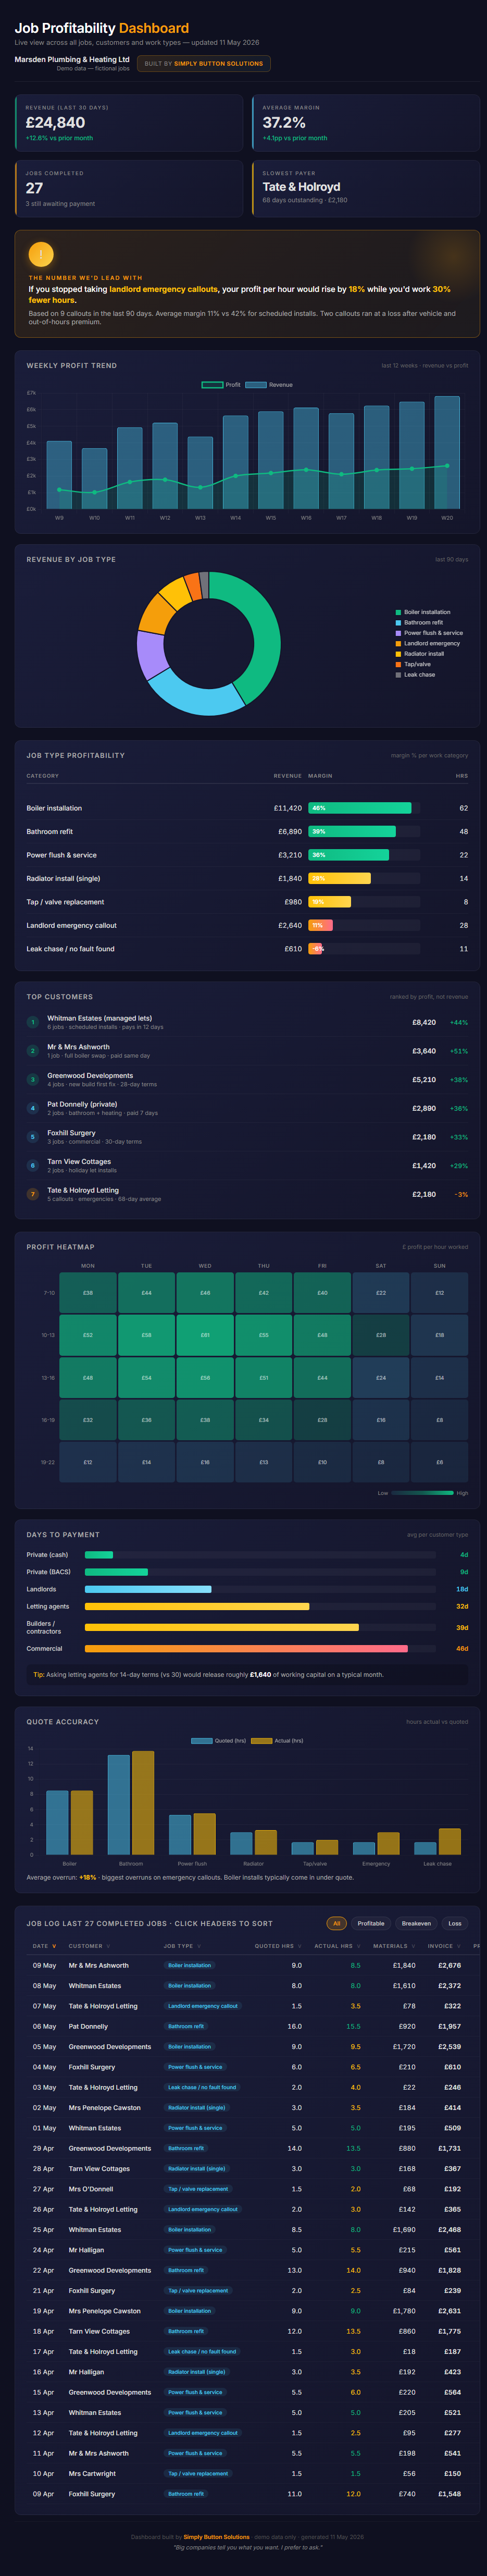
Job Profitability Dashboard
Marsden Plumbing & Heating Ltd. 27 jobs, customer profitability ranking, weekly profit heatmap.
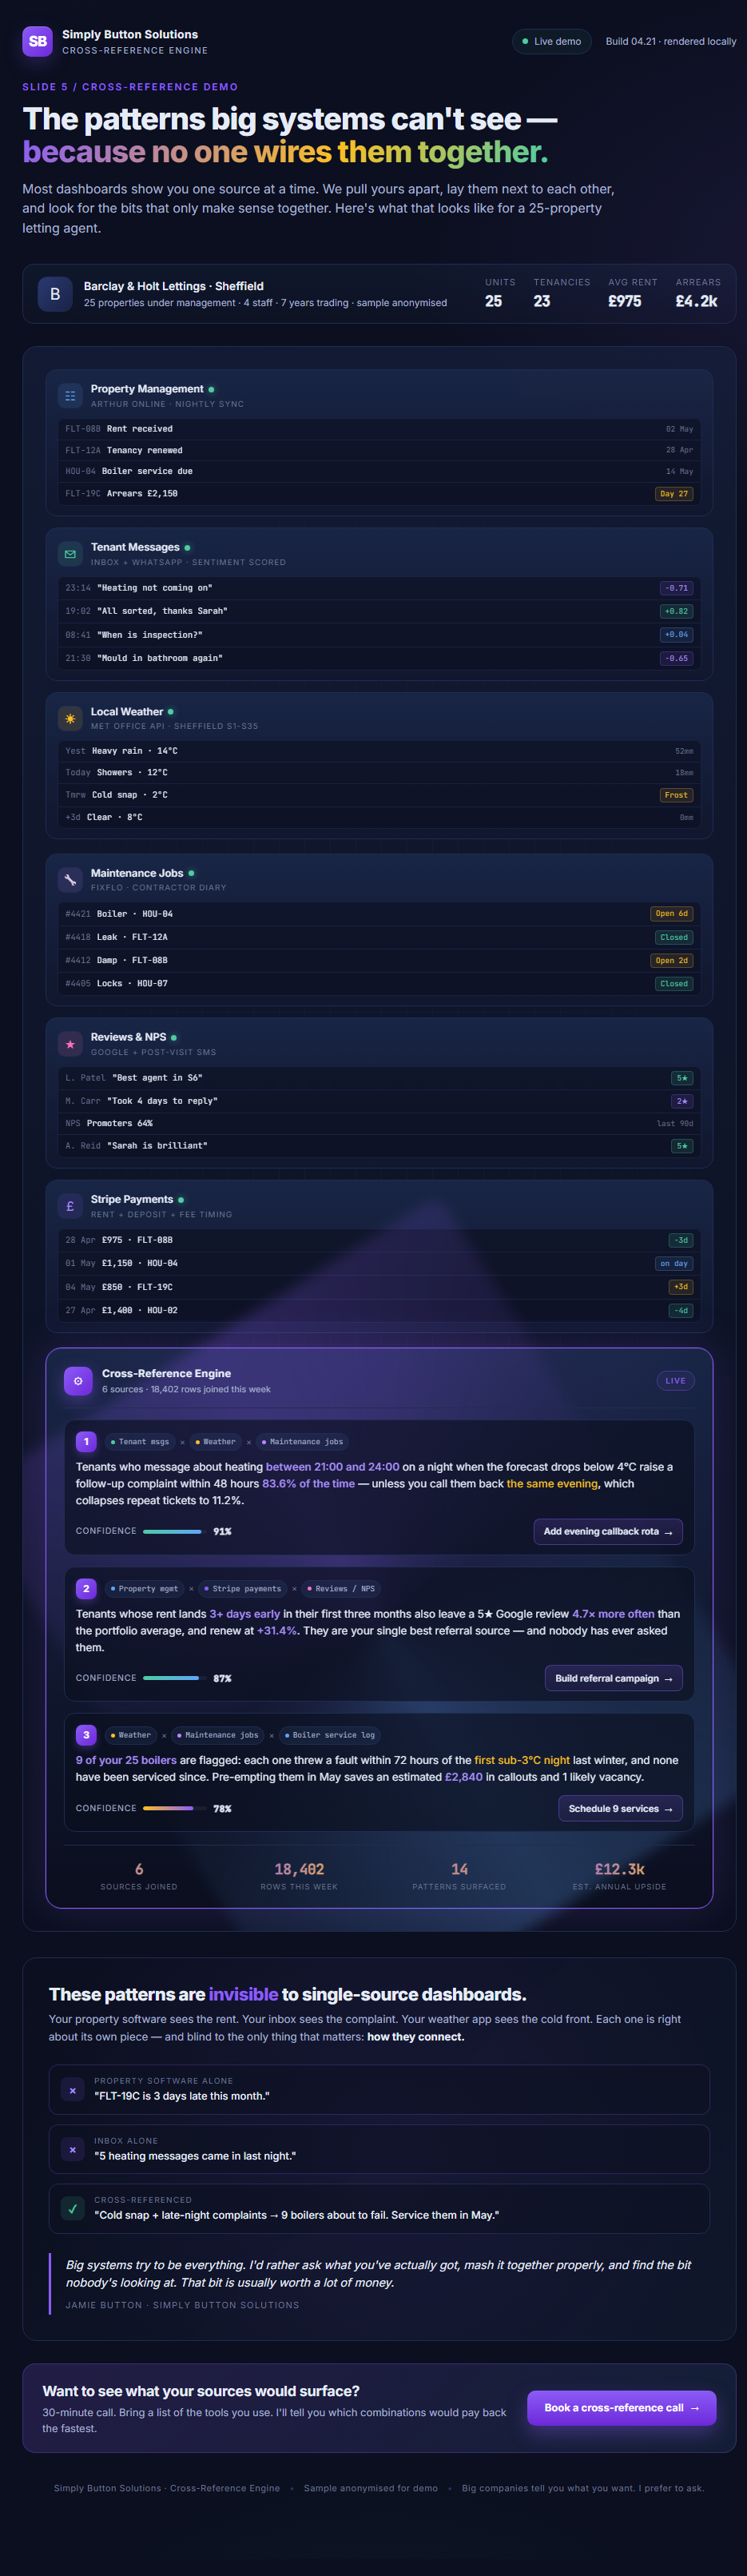
Cross-Reference Engine
Barclay & Holt Lettings, Sheffield. Six disparate data sources crossed for insights big systems can't see.
Bookings & Cover Forecasts
Independent café / restaurant. Bookings heatmap, weather-correlated forecast, no-show analysis.
Customer Retention
Risk-scored customer list. Reasons-they-might-leave. Specific intervention recommendations.
Local Market Scan
What competitors charge. What their reviews complain about. Where the pricing & positioning gaps are.
Solar / EPC Uplift ROI
Which properties to solar-up FIRST. Government grants eligibility. ROI by property.
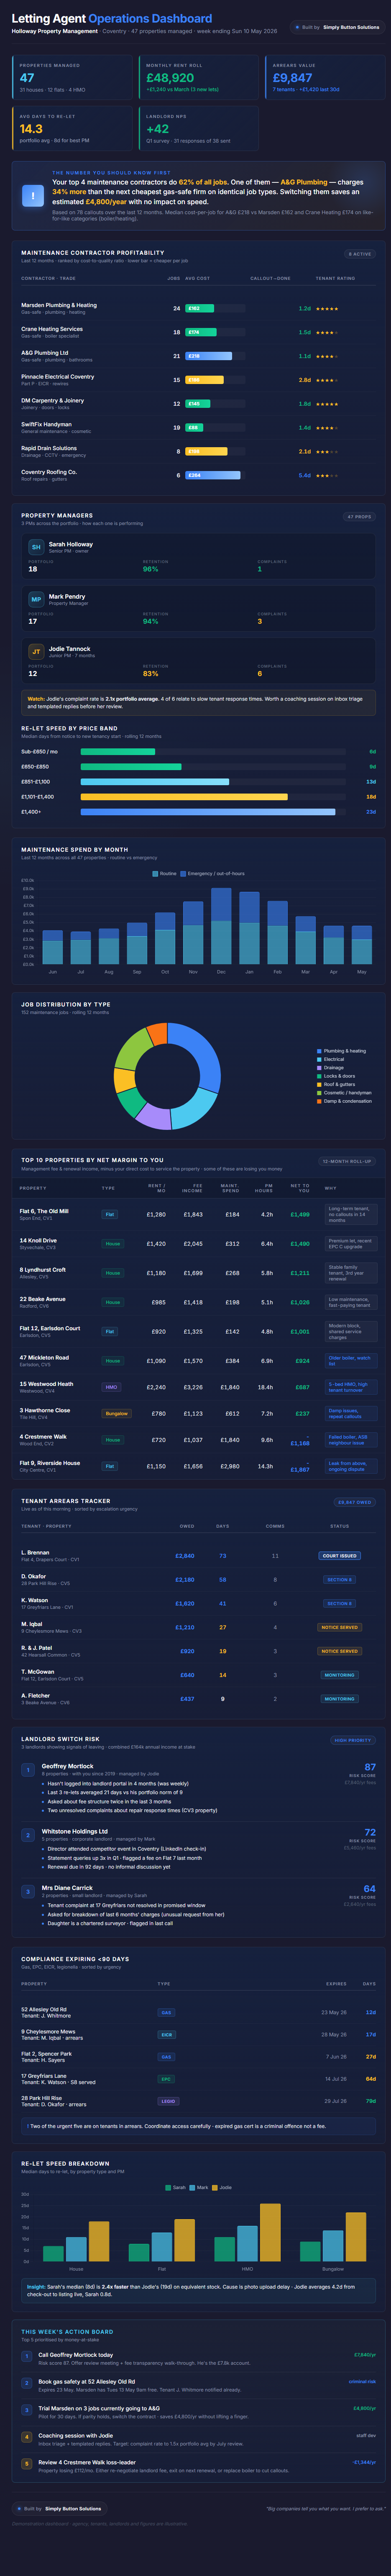
Letting Agent Operations
Contractor profitability. Loss-leader properties. Tenant arrears. Landlord switch-risk.
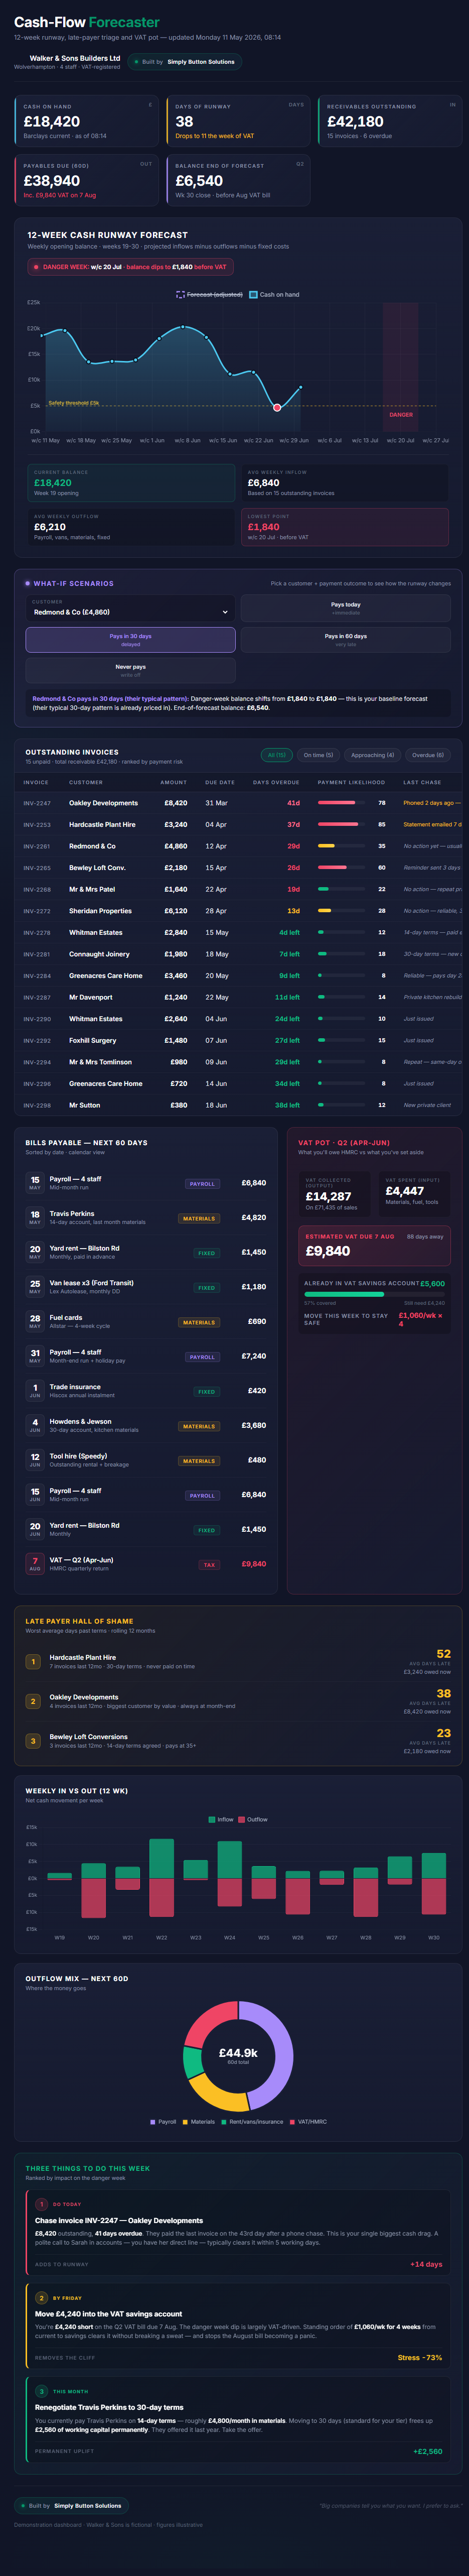
Cash-flow Forecaster
12-week cash runway. Late-payer hall of shame. VAT savings tracker. Scenario stress-testing.